01
GA4/Ads reporting structure
Align key events, conversions and reports so numbers answer practical business questions.
Reporting dashboards
If your numbers are spread across GA4, Google Ads, forms, spreadsheets, CRMs and inboxes, I can help turn the reporting mess into a clearer dashboard or repeatable reporting workflow.
These are signs the business needs a clearer reporting loop, not another spreadsheet copied by hand.
The goal is to turn scattered numbers into a reporting loop the business can actually use.
01
Align key events, conversions and reports so numbers answer practical business questions.
02
Connect campaign, keyword and landing-page context to the enquiries that actually arrive.
03
Standardise fields and statuses so leads can be compared without spreadsheet surgery.
04
Turn fragile manual reporting sheets into a repeatable dashboard or import process.
05
Choose the lightest reporting surface the business can maintain.
06
Create a repeatable check-in rhythm for traffic, leads, quality and follow-up.
07
Add checks for duplicate events, missing source data and numbers that no longer line up.
These examples show the kind of visibility work that turns scattered numbers and status updates into something easier to trust.
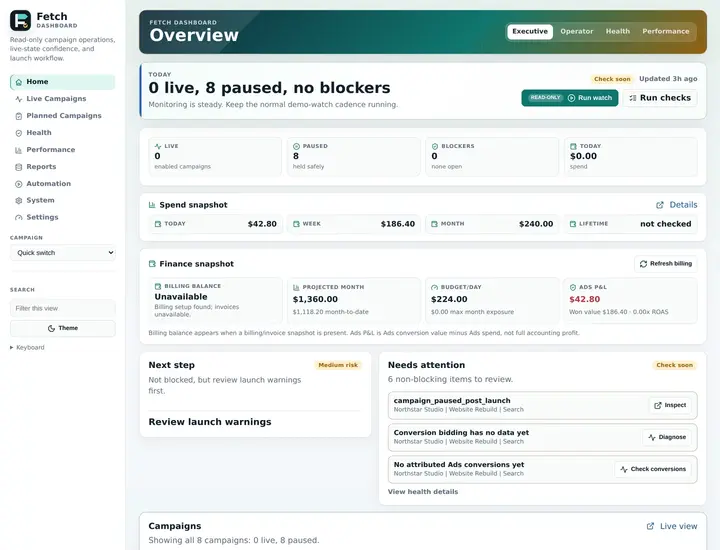
Read-only audit and validation tooling
A review workflow for pulling campaign, search term, conversion, landing page, tracking and performance data into safer audit loops.
Why it matters here: Campaign and lead reporting only helps when tracking, landing pages and source data can be checked together.
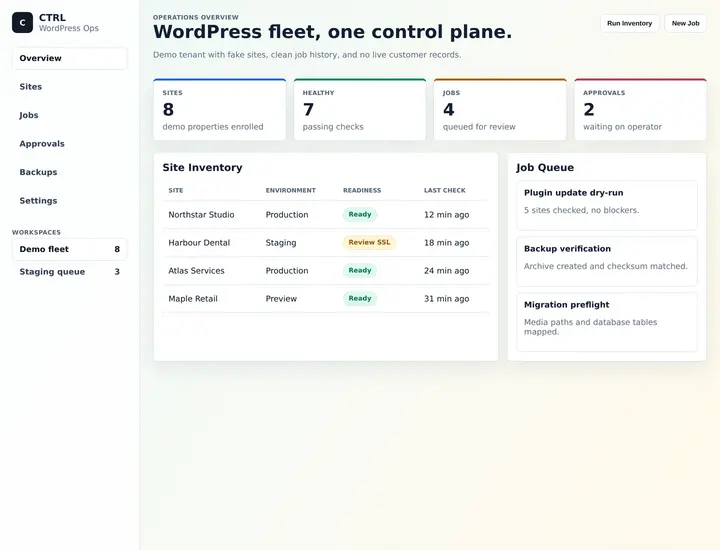
WordPress maintenance workflow
A maintenance and operations layer for keeping WordPress sites, jobs, state and follow-up work easier to see and manage.
Why it matters here: Operational visibility is useful when it turns scattered state into something supportable.
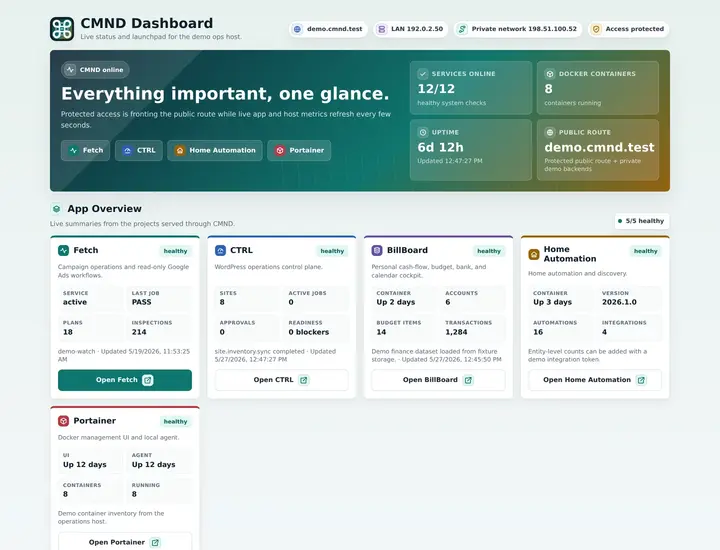
Support and service registry
A registry for service routes, status feeds, documentation and deployed app entry points so support context is not scattered.
Why it matters here: Reporting is easier to trust when service status and support context are not scattered.
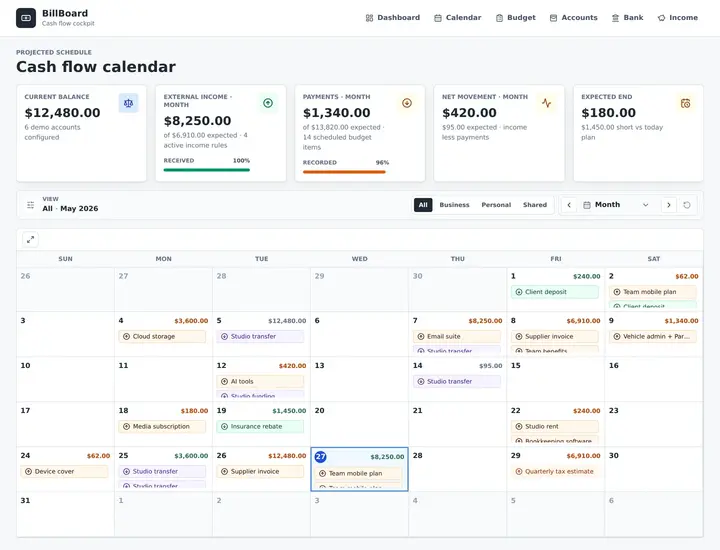
Cash-flow planning workflow
A local single-user cash-flow MVP built around calendar, budget, accounts and bank views.
Why it matters here: Reporting only helps when the numbers are tied to a repeatable process rather than spreadsheet drift.
Good first step
I will review the current reporting sources, identify what can and cannot be trusted, and map the simplest dashboard or reporting workflow worth building.
Request a reporting auditUseful reporting starts with definitions and confidence before it becomes a dashboard.
Review GA4, Ads, forms, spreadsheets, CRM fields and lead statuses.
Decide what counts as an enquiry, qualified lead, source and follow-up state.
Create the lightest dashboard or reporting workflow that answers the real questions.
Leave checks for duplicate events, missing fields and numbers that drift.
Useful reporting starts with trusted sources, clean definitions and numbers that answer real follow-up questions.
Fit check
Scope check
They often use different attribution, timing, consent and event definitions. The useful question is which numbers are trusted for decisions.
Yes. Spreadsheets can feed a dashboard or be cleaned into a more repeatable import/reporting workflow.
Yes, if the lead workflow captures status or quality data. That is often more useful than raw enquiry counts.
Yes, where it is the lightest suitable reporting surface. A custom dashboard or spreadsheet workflow may sometimes be more practical.
Yes. I can review duplicate events, missing source fields, unclear conversions and reports that no longer line up.
Clear source definitions, stable fields, known limitations, duplicate checks and numbers that can be traced back to real leads or actions.
10 Start
I'll review the sources, fields, statuses and reports, then map the simplest dashboard or reporting workflow worth building.
A rough version is fine; context is useful. Prefer email?
Email me directly